Politecnico di Milano has started implementing initiatives aimed at reducing its CO2 emissions since 2015. For this reason, the University has included the launch of the Carbon Management project among its objectives, aimed at quantifying, monitoring, and reducing its CO2 emissions.
To date, the following actions have been implemented:
• Annual CO2 emissions inventories for the years 2015-2022;
• Two editions of the CO2 Emissions Mitigation Plan (latest edition, 2024).
The first edition of the Climate Change Adaptation Plan is also in the process of being drafted. Furthermore, the following documents are essential for the drafting of the Inventories, as well as the Mitigation Plan and the Adaptation Plan:
• The Annual Energy Budget (AEB): filled out for the years 2017 to 2023;
• The Home-University Commute Plan (HWCP, latest edition, 2024).
The inventory is updated annually, with the 2015 inventory establishing the baseline against which emission trends are monitored, serving as the reference year for reduction commitments.
All six campuses have been considered (Milano Città Studi Campus, Milano Bovisa, Lecco, Cremona, Mantua, and Piacenza), as well as the entire Politecnico community (students, professors, technical and administrative staff, research fellows, PhD students, etc.).
Only carbon dioxide (CO2) emissions were considered, as they overwhelmingly dominate the emissions of other pollutants typically assessed (CH4, N2O, F-gases). All sources of direct and indirect emissions have been considered, including Scope 1 and Scope 2 as well as some sources of indirect emissions from Scope 3 related to the transport sector.
The calculation of CO2 emissions forms the necessary and functional knowledge base for the Politecnico di Milano’s objectives of reducing its carbon footprint and for formalizing reduction commitments for 2025 and 2030, as outlined in the University’s Strategic Sustainability Plan. These commitments are expressed in terms of annual per capita emissions (kgCO2/(person.year)).
Figures 1 and 2 illustrate the trend in annual per capita CO2 emissions from 2015 to 2022, broken down by sectors and activities considered in the creation of the inventories.
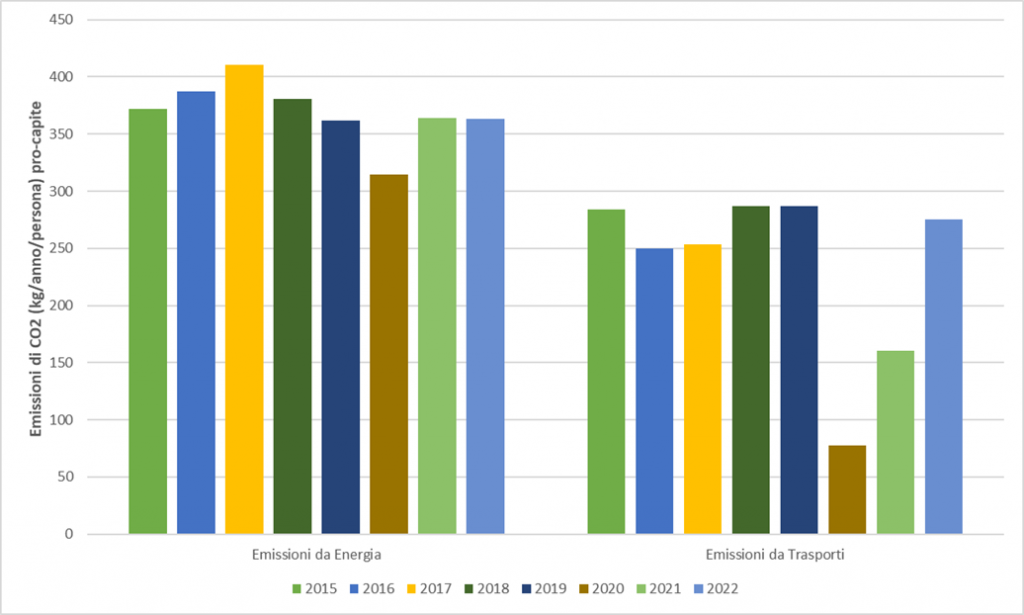
Figure 1: Trend of CO2 emissions (kgCO2/person.year) per capita for the energy and transport sector, years 2015-2022.
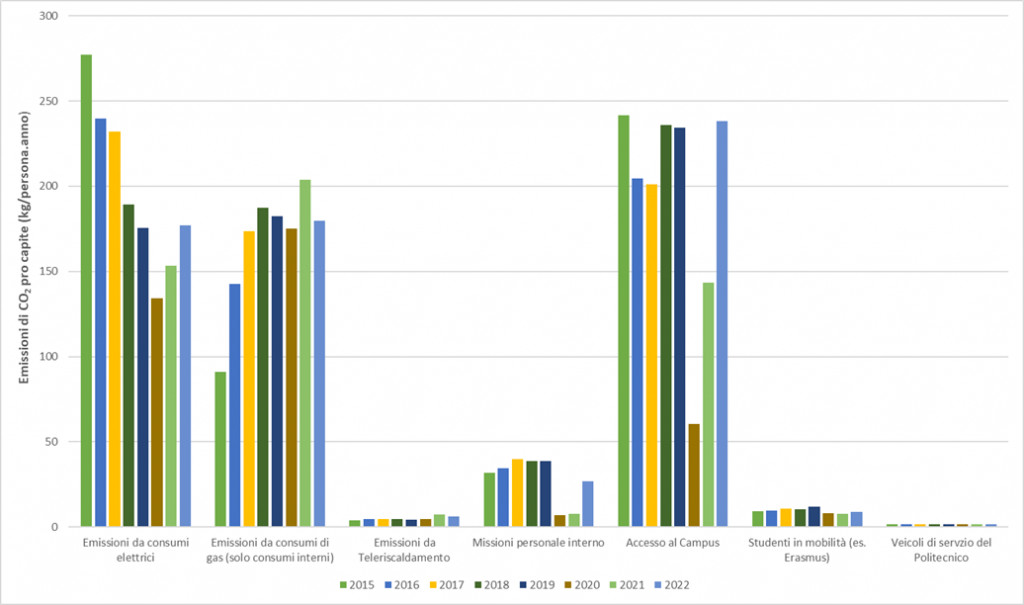
Figure 2: Trend of CO2 emissions (kgCO2/person.year) per capita for the energy and transport sector (detailed by activity), years 2015-2022.